plot examples in vignette
Created by: srcorsi-USGS
When I copy/paste the graphics examples for boxplots and stacked bars, the code for the examples currently just plots the next graph right on top of the previous graph rather than making a new plot page in RStudio. How do we tell ggplot to put it in the next page without clearing out all plots with dev.off()?
#Single site example library(dplyr)
maumee <- filter(chemicalSummary, shortName == "Maumee")
maumee_site <- filter(tox_list$chem_site, Short Name == "Maumee")
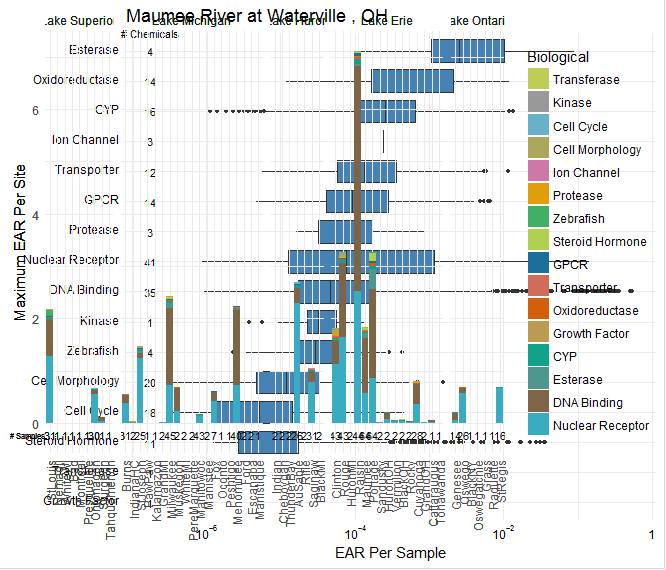
maumee_plot <- plot_tox_boxplots(maumee, "Biological",title = maumee_site$Fullname[1])
gb <- ggplot2::ggplot_build(maumee_plot)
gt <- ggplot2::ggplot_gtable(gb)
gtlayoutclip[gtlayoutname=="panel"] <- "off"
grid::grid.draw(gt)
stack_plot <- plot_tox_stacks(chemicalSummary, chem_site = tox_list$chem_site, category = "Biological")
gb <- ggplot2::ggplot_build(stack_plot)
gt <- ggplot2::ggplot_gtable(gb)
gtlayoutclip[gtlayoutname=="panel-1-1"] = "off"
grid::grid.draw(gt)
@ldecicco-USGS