Tweaks to findex global maps page
Context
This MR continues to add changes and tweaks to the findex global maps page.
Summary of changes
All changes have outputs in src/assets/images/.
Changes include additions to the targets pipeline that create the following:
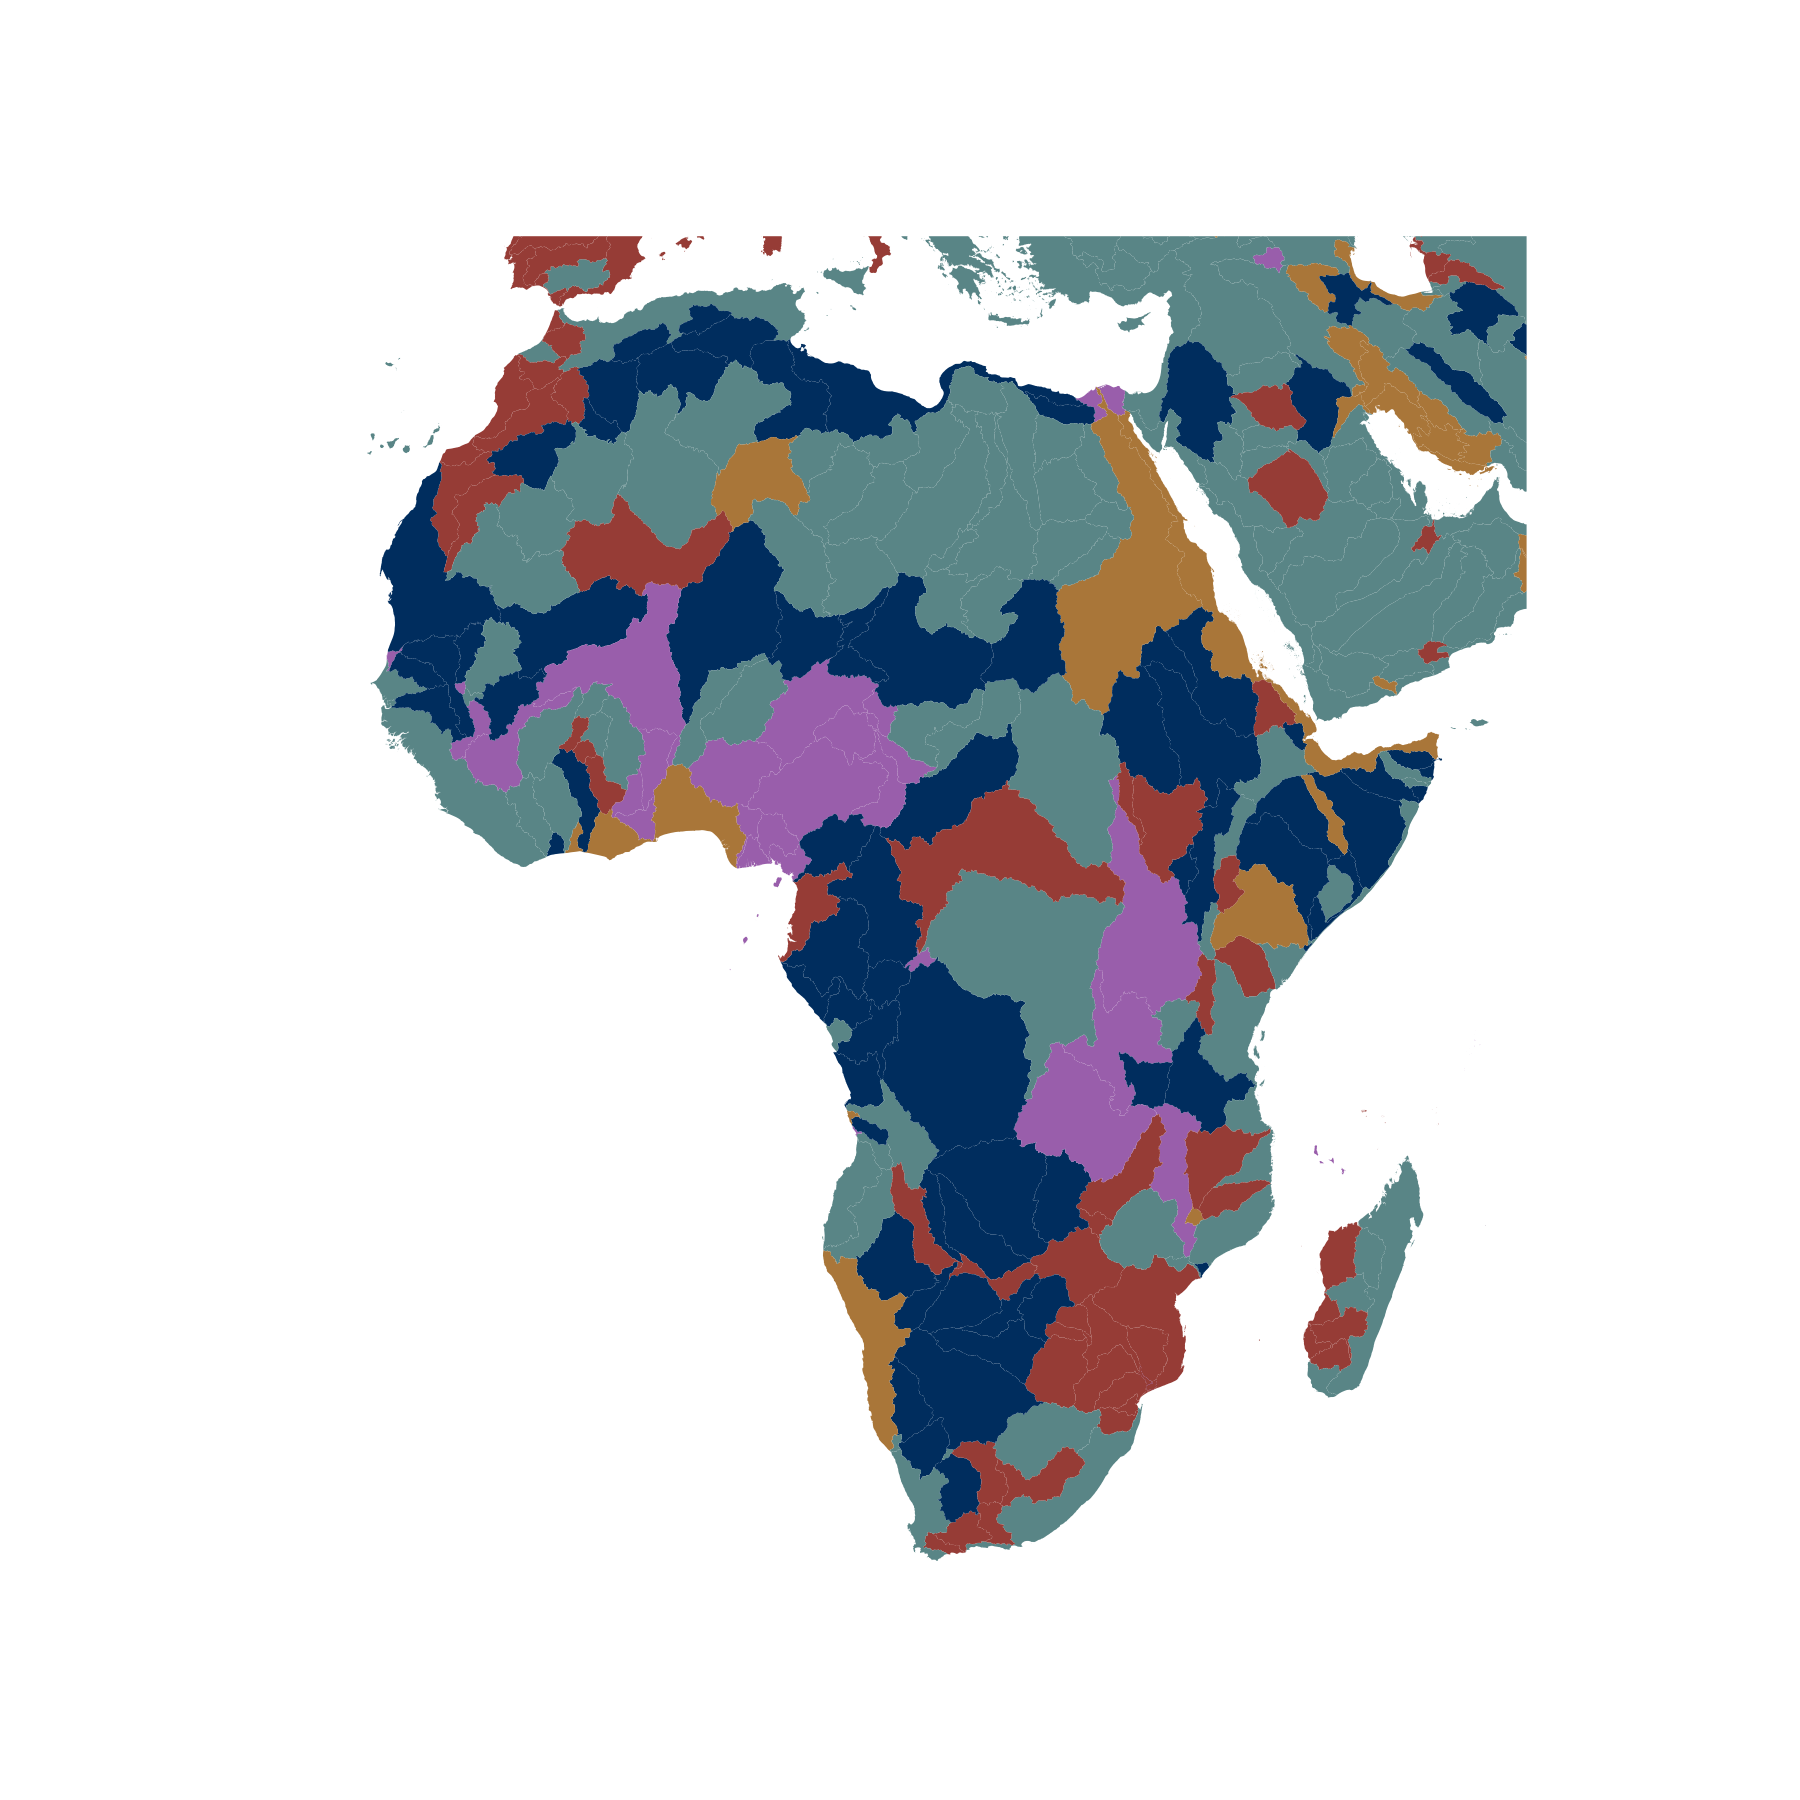
- Create a global map of the top threat for each basin
- Create a series of global maps showing top threat for each basin, filtered to a specific threat (there are 5 major threat categories, so 5 sub-maps were created)
- Create a thumbnail for the findex global maps page
- Reduce white space around global map pngs
- Use cowplot to place legend text
I also downloaded each major and sub threat category icon as a svg in the matching color.
Expected results
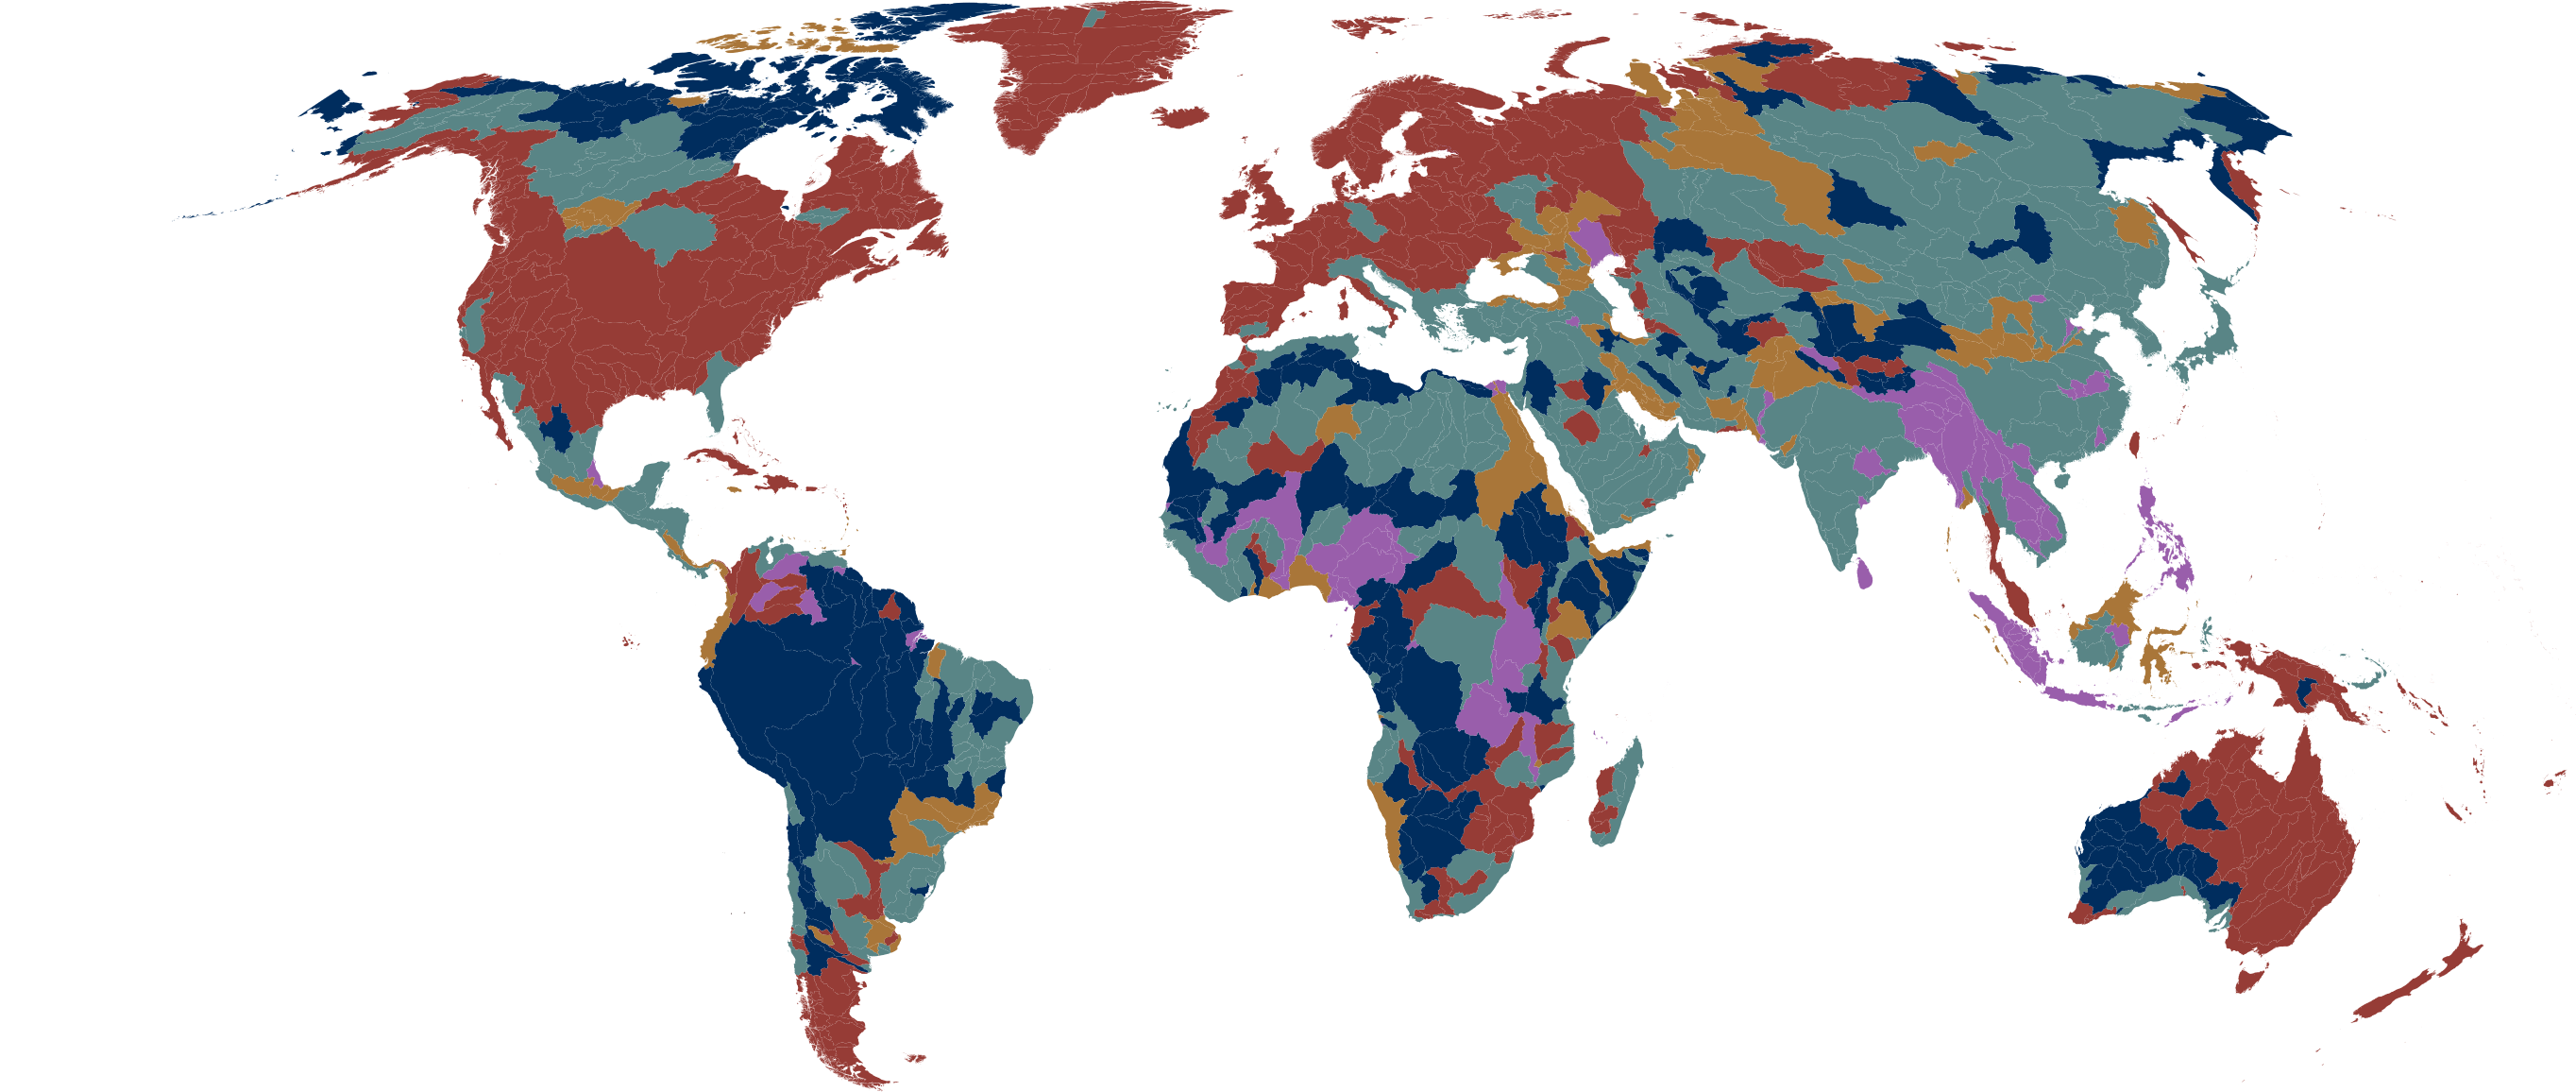
Overall top threat map: all_threat_by_basin.png
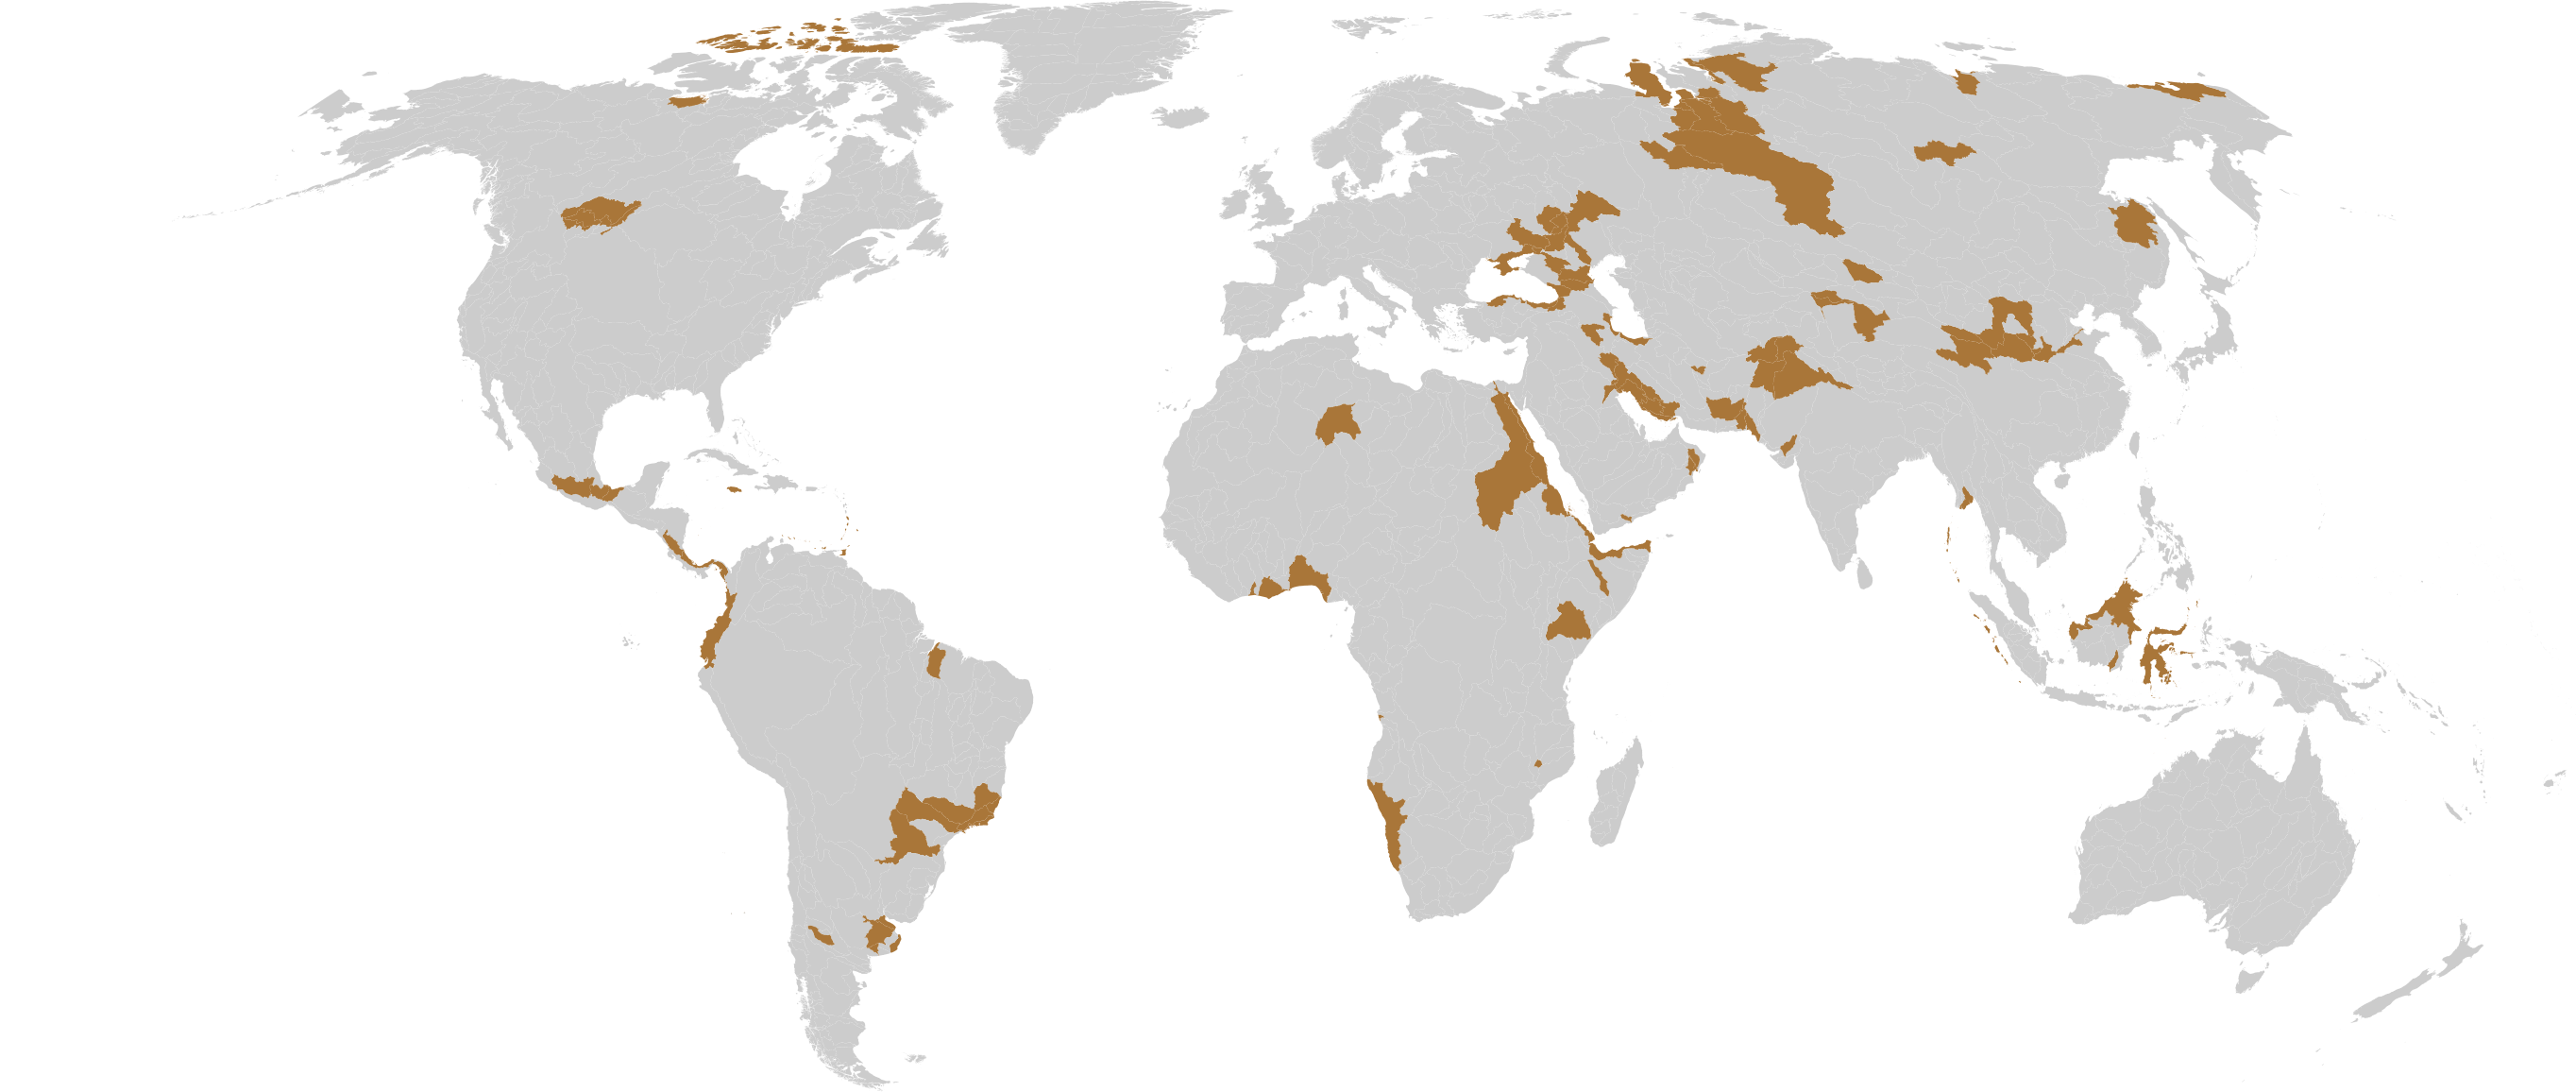
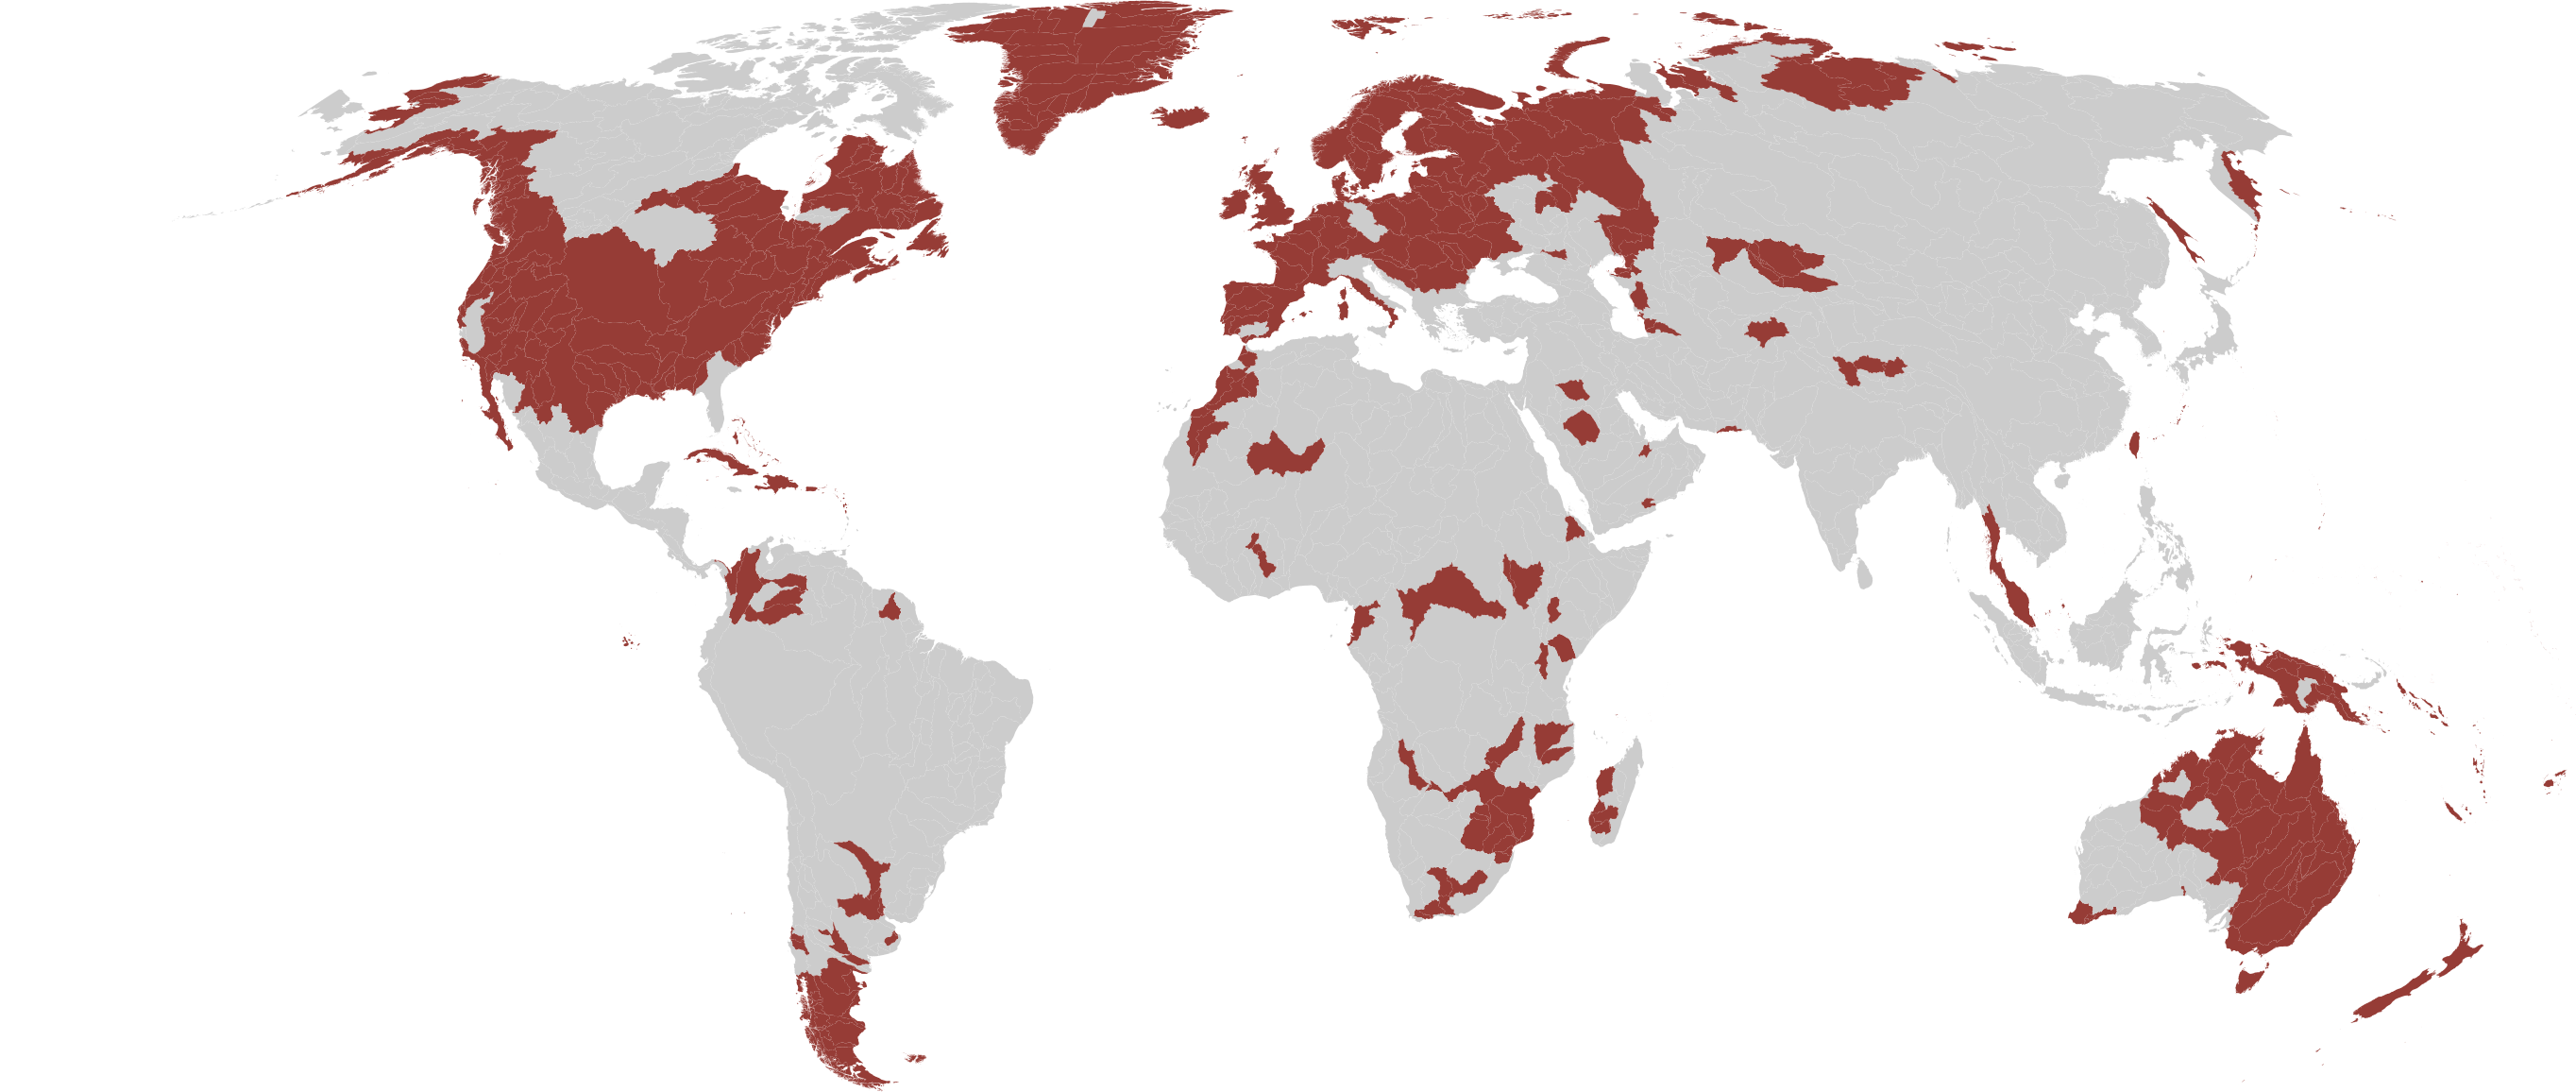
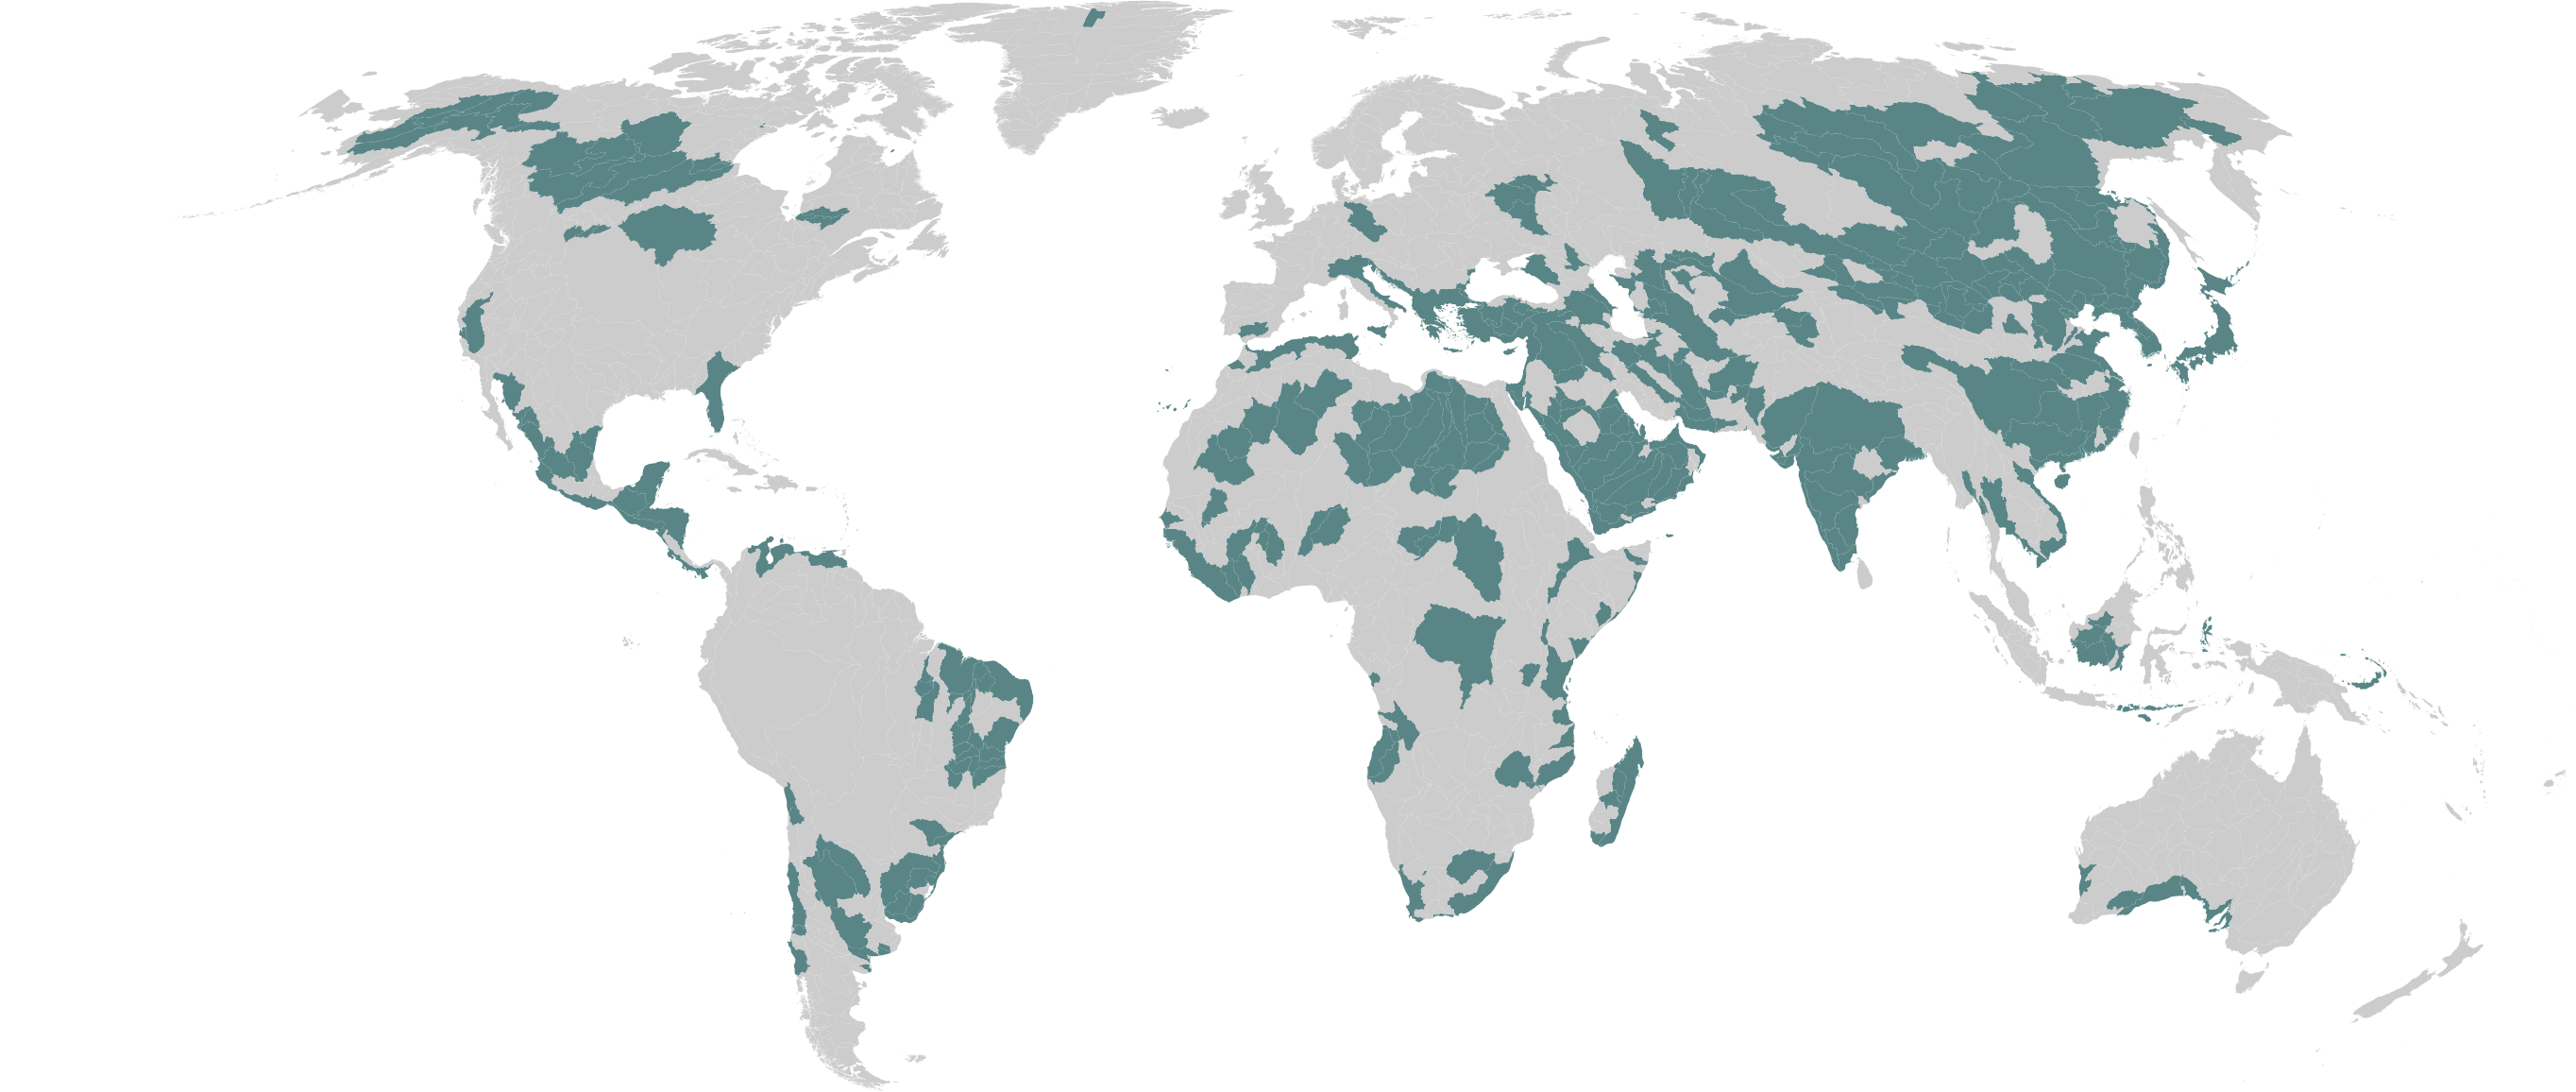
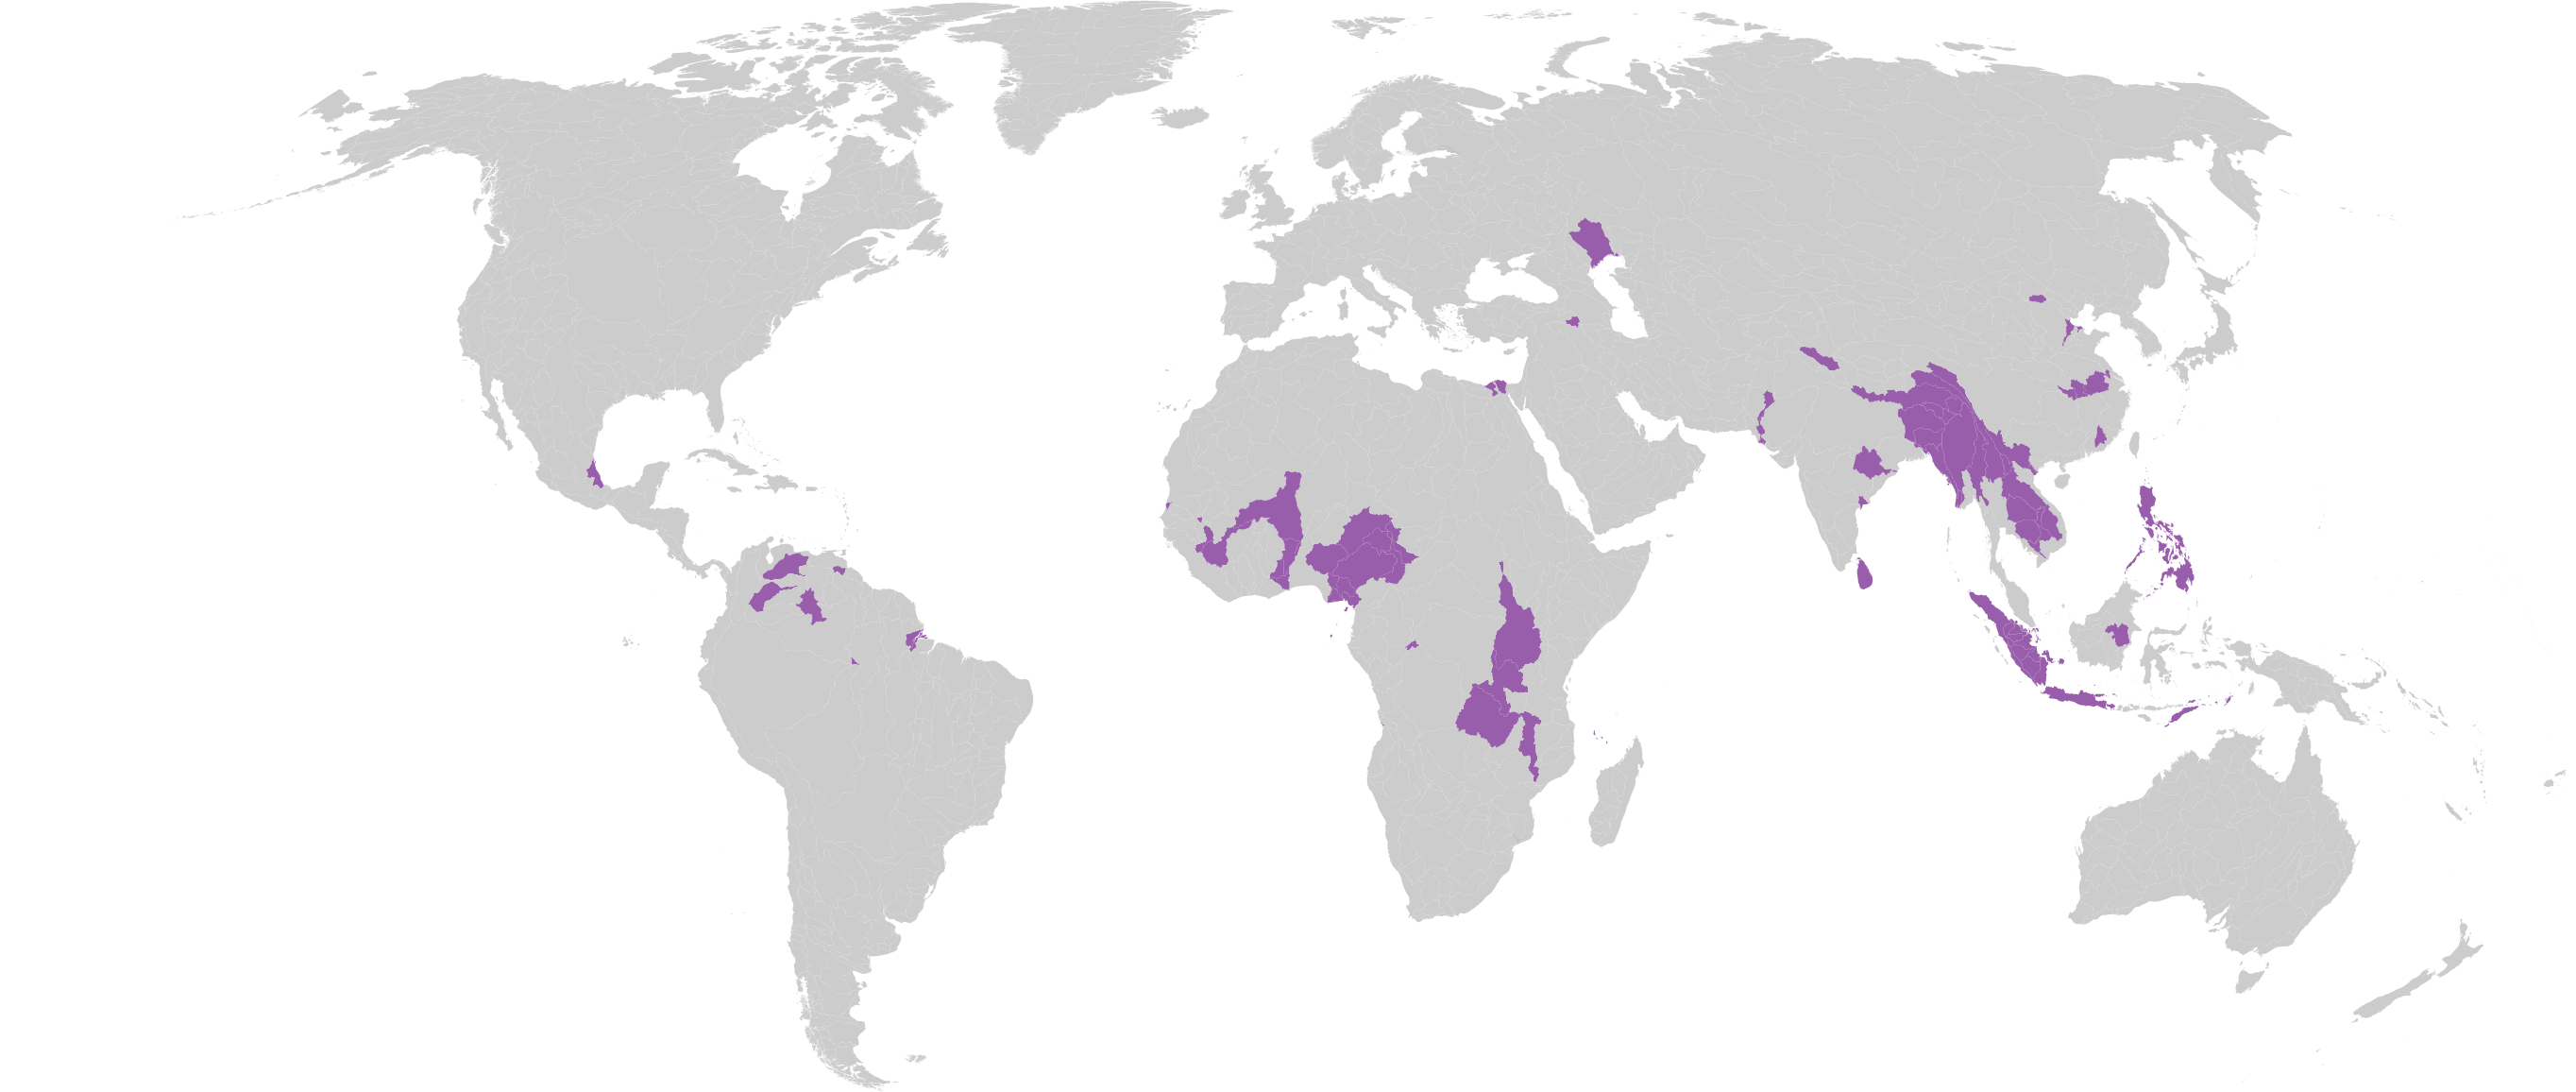
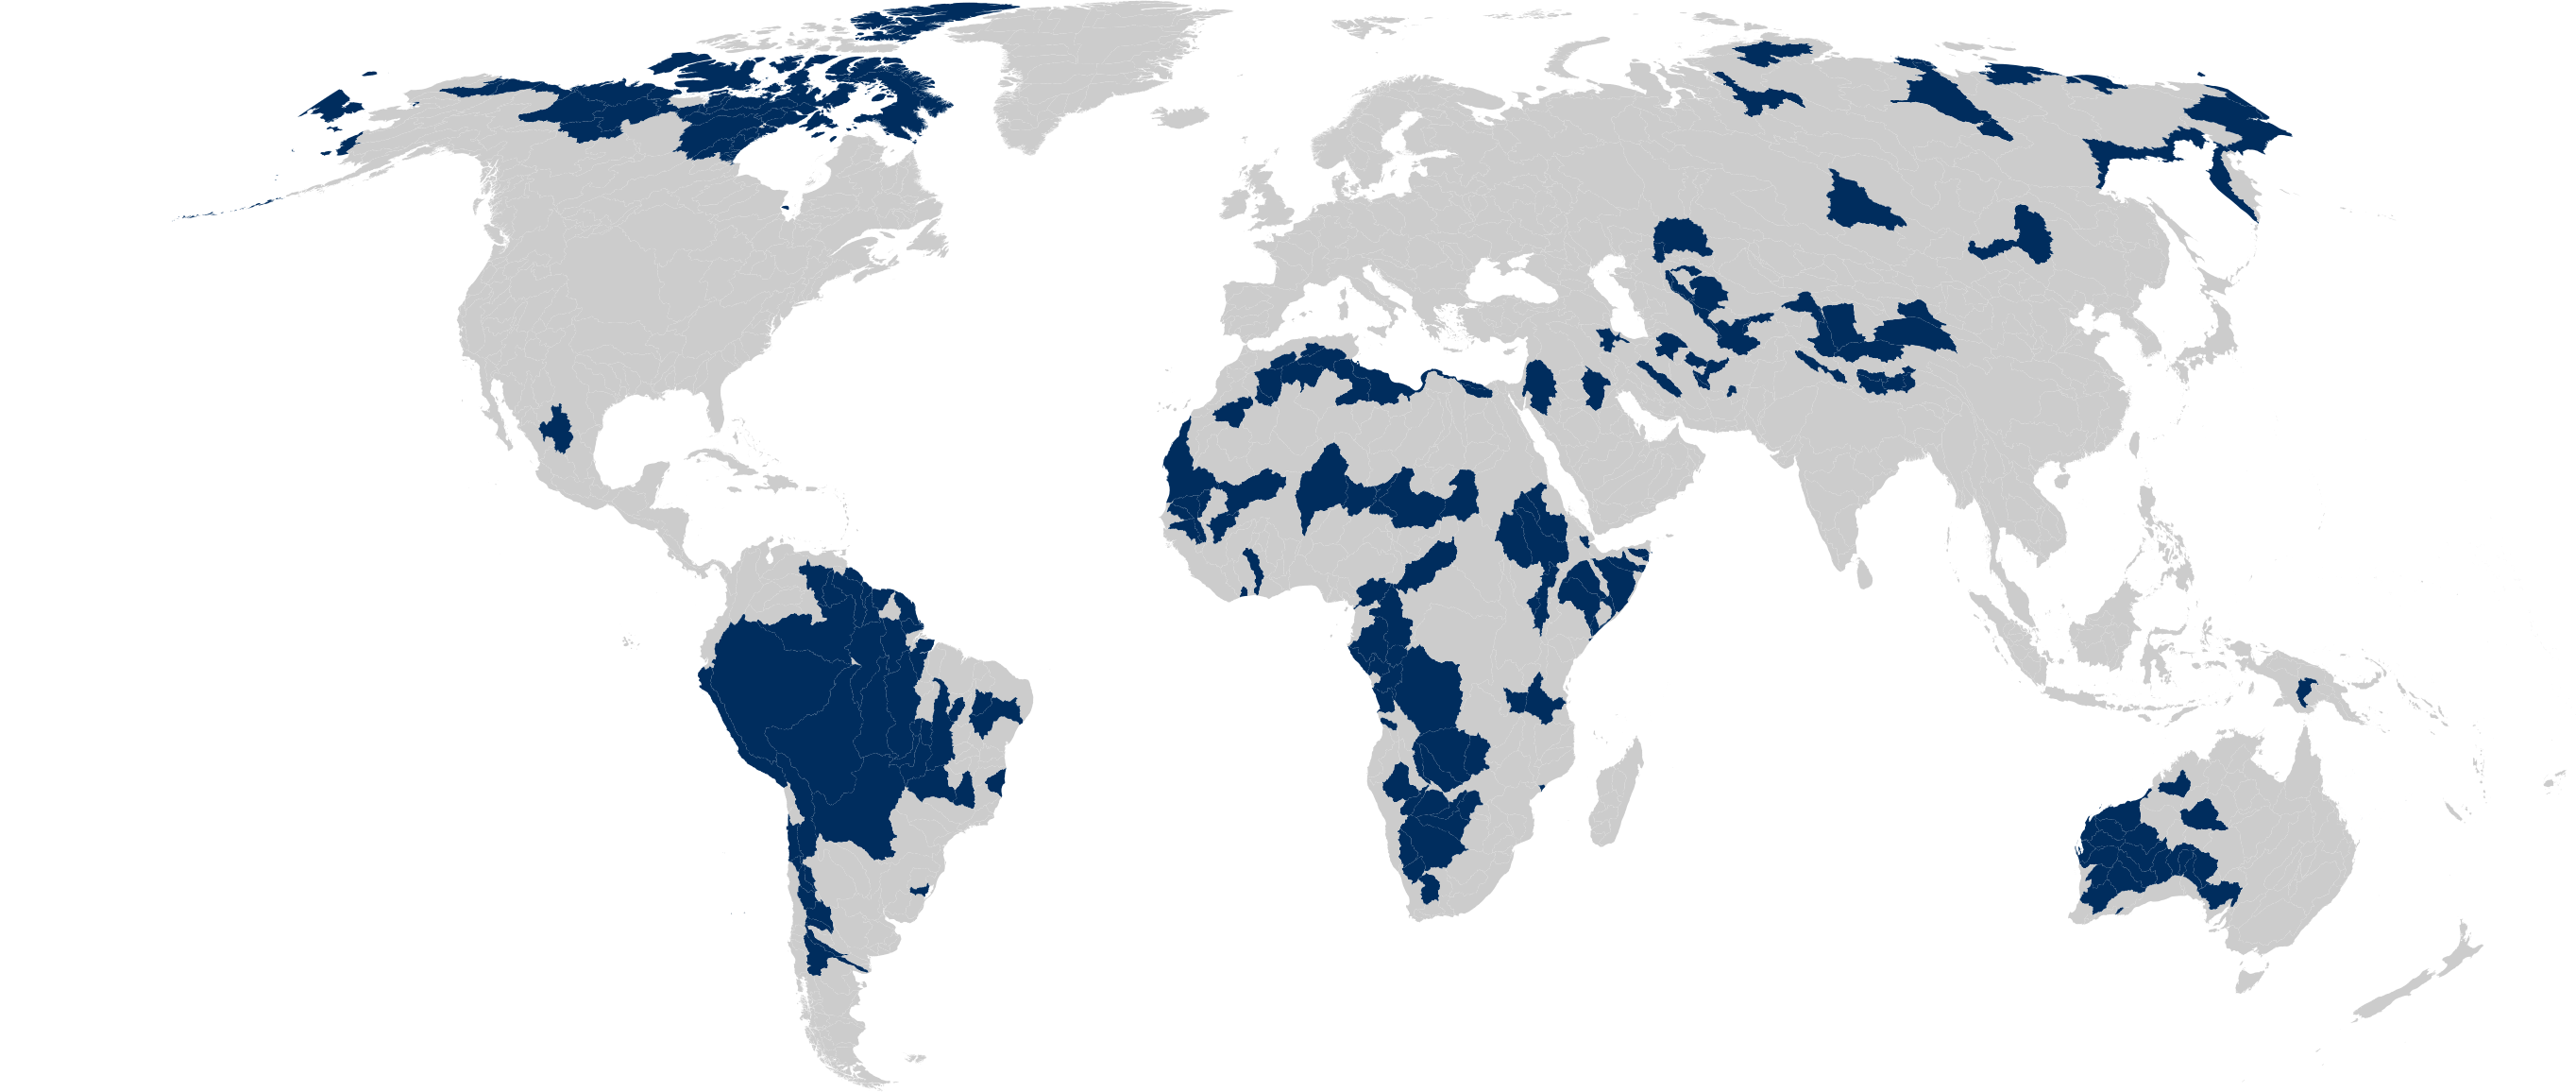
Top threat maps filtered to a specific threat: these will be used in the interactive piece of the overall top threat map. Users will be able to select a threat category which will be highlighted while the rest of the threats become grayed out.
Pollution_threat_by_basin.png, Invasive_species_threat_by_basin.png, Habitat_threat_by_basin.png, Fishing_pressure_threat_by_basin.png, and Climate_and_weather_threat_by_basin.png
Findex global maps thumbnail: threat_by_basin_thumbnail.png. This image has a white margin around it that is hard to see on the white gitlab background.
Threat icon svgs: these follow the naming convention threat-code. For example, habitat is habitat-29572. Here is an example of the subcategory threat naming convention: H-dams-3916913. There is one subcategory threat icon missing, I am waiting to hear back from the SMEs about it. It is for change in flooding.
Verification of results
After running the pipeline, all the maps should match the ones shown in this MR description. There should also be threat icons for every threat category (except change in flooding). All legends should look very similar to their previous versions.
Requested review
- Run the pipeline and make sure no errors pop up
- Check the map outputs in
src/assets/images/to make sure they match the ones in this MR description - Check to make sure there are threat icons for every major and sub threat category (change in flooding pending)
- Let me know if tweaks need to be made to legend text spacing or sizing
- Double check that all global map pngs have minimal white space around the map
- I would love any feedback or suggested/required changes to clean up the pipeline. Feedback on the thumbnail and maps themselves is welcome as well.
Next steps
Next steps include implementing the top threat by basin map interactivity at the top of the global maps page.